Article Purpose
This article explores image edge detection implemented through computing pixel neighbourhood standard deviation on RGB colour images. The main sections of this article consists of a detailed explanation of the concepts related to the standard deviation edge detection algorithm and an in-depth discussion and a practical implementation through source code.
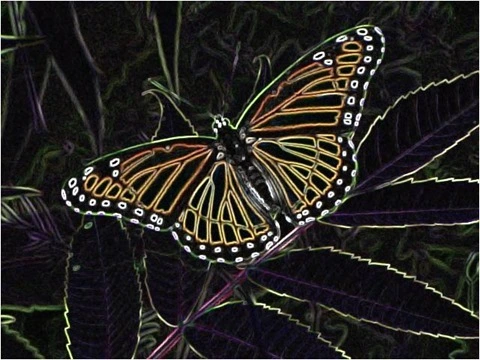
Butterfly Filter 3×3 Factor 5.0
Sample Source Code
This article is accompanied by a sample source code Visual Studio project which is available for download here.
Using the Sample Application
This article’s accompanying sample source code includes a Windows Forms based sample application. The sample application provides an implementation of the concepts explored by this article. Concepts discussed can be easily replicated and tested by using the sample application.
Source/input image files can be specified from the local file system when clicking the Load Image button. Additionally users also have the option to save resulting filtered images by clicking the Save Image button.
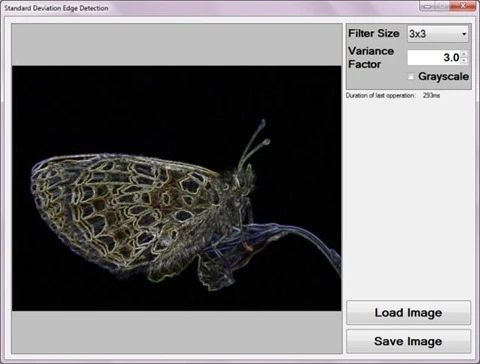
The sample application user interface exposes three filter configuration values to the end user in the form of predefined filter size values, a grayscale output flag and a variance factor. End users can configure whether filtered result images should express image edges using source image colour values or in grayscale. The filter size value specified by the user determines the number of pixels included when calculating standard deviation values.
Filter size has a direct correlation to the extend at which gradient edges will be represented in resulting images. Faint edge values require larger filter size values in order to be expressed in a resulting output image. Larger filter size values require additional computation and would thus have a longer completion time when compared to smaller filter size values.
The following screenshot captures the Standard Deviation Edge Detection sample application in action.
Standard Deviation Edge Detection
Image edge detection can be achieved through a variety of methods, each associated with particular benefits and trade offs. This article is focussed on image edge detection through implementing standard deviation calculations on a pixel neighbourhood.
Pixel Neighbourhood
A pixel neighbourhood refers to a set of pixels, all of which are related through pixel location coordinates. The width and height of a pixel neighbourhood must be equal, in other words, a pixel neighbourhood can only be square. Additionally, the width/height of a pixel neighbourhood must be an uneven value. When inspecting a pixel’s neighbouring pixels, the pixel being inspected will always be located at the exact center of the pixel neighbourhood. Only when a pixel neighbourhood’s width/height are an uneven value can such a pixel neighbourhood have an exact center pixel. Each pixel represented in an image has a different set of neighbours, some neighbours overlap, but no two pixels have the exact same neighbours. A pixel’s neighbouring pixels can be determined when considering the pixel to be at the center of a block of pixels, extending half the neighbourhood size less one in horizontal, vertical and diagonal directions.
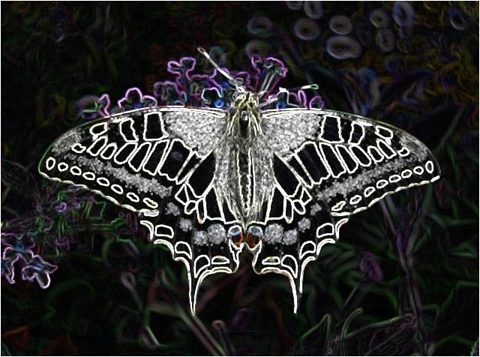
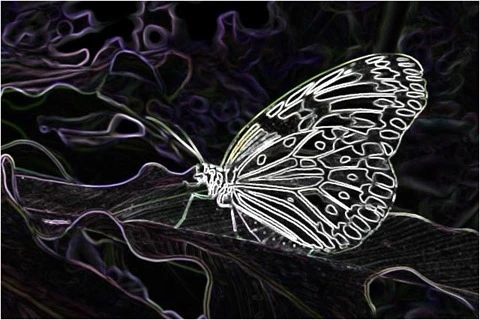
Butterfly Filter 3×3 Factor 5
Pixel Neighbourhood Mean value
Mean value calculation forms a core part in calculating standard deviation. The mean value from a set of values could be considered equivalent to the value set’s average value. The average of a set of values can be calculated as the sum total of all the values in a set, divided by the number of values in the set.
Standard Deviation
From the Standard Deviation Wikipedia page we gain the following quote:
In statistics, the standard deviation (SD, also represented by the Greek letter sigma, σ for the population standard deviation or s for the sample standard deviation) is a measure that is used to quantify the amount of variation or dispersion of a set of data values. A standard deviation close to 0 indicates that the data points tend to be very close to the mean (also called the expected value) of the set, while a high standard deviation indicates that the data points are spread out over a wider range of values
A pixel neighbourhood’s standard deviation can indicate whether a significant change in image gradient is present in a pixel neighbourhood. A large standard deviation value is an indication that the neighbourhood’s pixel values could be spread far from the calculated mean. Inversely, a small standard deviation will indicate that the neighbourhood’s pixel values are closer to the calculated mean. A sudden change in image gradient will equate to a large standard deviation.
Steps required in calculating standard deviation can be described as follows:
- Calculate the Mean value. Calculate the sum of all pixels in a pixel neighbourhood then divide the sum total using the number of pixels contained in a neighbourhood. In essence calculating the mean value should be seen as calculating the average of all the pixels in a neighbourhood.
- Calculate combined Variance using Mean value. Subtract the mean value from each pixel in the neighbourhood, the result should be squared and added to a sum total. Variance should then be calculated as the calculated mean subtracted squared pixel value divided using the number of pixels in a neighbourhood.
- Calculate standard deviation as the Variance square root.
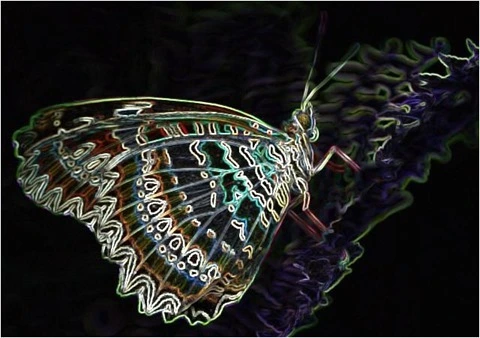
Butterfly Filter 3×3 Factor 5
Standard Deviation Edge Detection Algorithm
The standard deviation edge detection algorithm is based in the concept of standard deviation, providing additional capabilities. The algorithm allows for a more prominent expression of variance through means of a variance factor. Calculated variance values can be increased or decreased when implementing a variance factor. When variances are less significant, resulting images will express gradient edges at faint/low intensity levels. Providing a variance factor will result in output images expressing gradient edges at a higher intensity.
Variance factor and filter size should not be confused. When source gradient edges are expressed at low intensities, higher filter sizes would result in those low intensity source edges to be expressed in resulting images. In a scenario where high intensity gradient edges from a source image are expressed in resulting images at low intensities, a higher variance factor would increase resulting image gradient edge intensity.
The following list provides a summary of the steps required to implement the standard deviation edge detection algorithm:
- Iterate through all of the pixels contained within an image.
- For each pixel being iterated, determine the neighbouring pixels. The pixel neighbourhood size will be determined by the specified filter size.
- Calculate the Mean value of the current pixel neighbourhood.
- Calculate the Variance. Subtract the Mean value from each neighbourhood pixel, the result should be squared and summed to a variance total value. Finally, the variance total value should be divided by the number of pixels that make up the pixel neighbourhood. If a variance factor had been specified, the calculated variance value should be multiplied against it and the result assigned as the new calculated variance value.
- Calculate the Standard Deviation. Once the variance has been calculated the standard deviation can be expressed as the square root of the calculated variance value. The standard deviation value should be assigned to the result buffer pixel relating to the source buffer pixel currently being iterated.
It is important to note that the steps as described above should be applied per individual colour channel, Red, Green and Blue.
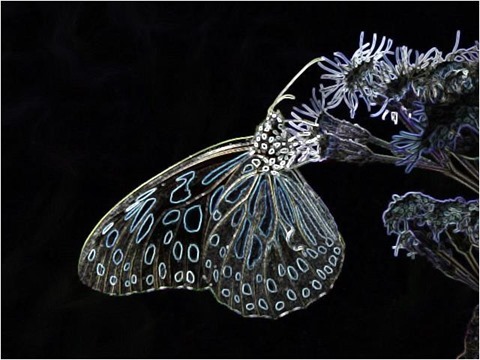
Butterfly Filter 3×3 Factor 4.5
Implementing a Standard Deviation Edge Detection filter
The sample source code that accompanies this article provides a public extension method targeting the Bitmap class. A private overloaded implementation of the StandardDeviationEdgeDetection method performs the bulk of the required functionality. The following code snippet illustrates the public overloaded version of the StandardDeviationEdgeDetection method:
public static Bitmap StandardDeviationEdgeDetection(this Bitmap sourceBuffer,
                                                    int filterSize,
                                                    float varianceFactor = 1.0f,
                                                    bool grayscaleOutput = true)
{
     return sourceBuffer.ToPixelBuffer()
                        .StandardDeviationEdgeDetection(sourceBuffer.Width,
                                                        sourceBuffer.Height,
                                                        filterSize,
                                                        varianceFactor,
                                                        grayscaleOutput)
                         .ToBitmap(sourceBuffer.Width, sourceBuffer.Height);
}
The StandardDeviationEdgeDetection method accepts 3 parameters, the first Bitmap parameter serves to signal that the method is an extension method targeting the Bitmap class. A brief description of the other parameters as follows:
- filterSize determines the pixel neighbourhood size. Note that the parameter is expected to reflect the pixel neighbourhood width/height. As an example, a filterSize parameter value provided as 3 would equate to a pixel neighbourhood consisting of 9 pixels, as would a filterSize of 5 indicate a neighbourhood of 25 pixels.
- varianceFactor signifies the factor value applied to a calculated variance.
- grayscale being a boolean value indicates whether the resulting image should be represented in grayscale, or in the original colour values from the source image.
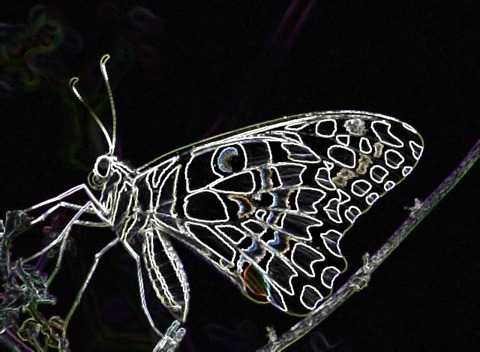
Butterfly Filter 3×3 Factor 4
The following code snippet relates the private implementation of the StandardDeviationEdgeDetection method, which performs all of the tasks required to implement the standard deviation edge detection algorithm.
private static byte[] StandardDeviationEdgeDetection(this byte[] pixelBuffer,
                                                     int imageWidth,
                                                     int imageHeight,
                                                     int filterSize,
                                                     float varianceFactor = 1.0f,
                                                     bool grayscaleOutput = true)
{
    byte[] resultBuffer = new byte[pixelBuffer.Length];

    int filterOffset = (filterSize - 1) / 2;
    int calcOffset = 0;
    int stride = imageWidth * pixelByteCount;

    int byteOffset = 0;
    var neighbourCount = filterSize * filterSize;

    var blueNeighbours = new int[neighbourCount];
    var greenNeighbours = new int[neighbourCount];
    var redNeighbours = new int[neighbourCount];

    double resetValue = 0;
    double meanBlue = 0, meanGreen = 0, meanRed = 0;
    double varianceBlue = 0, varianceGreen = 0, varianceRed = 0;

    varianceFactor = varianceFactor * varianceFactor;

    for (int offsetY = filterOffset; offsetY <
        imageHeight - filterOffset; offsetY++)
    {
        for (int offsetX = filterOffset; offsetX <
            imageWidth - filterOffset; offsetX++)
        {
            byteOffset = offsetY *
                            stride +
                            offsetX * pixelByteCount;

            meanBlue = resetValue;
            meanGreen = resetValue;
            meanRed = resetValue;

            varianceBlue = resetValue;
            varianceGreen = resetValue;
            varianceRed = resetValue;

            for (int filterY = -filterOffset, neighbour = 0;
                filterY <= filterOffset; filterY++)
            {
                for (int filterX = -filterOffset;
                    filterX <= filterOffset; filterX++, neighbour++)
                {
                    calcOffset = byteOffset +
                                    (filterX * pixelByteCount) +
                                    (filterY * stride);

                    blueNeighbours[neighbour] = pixelBuffer[calcOffset];
                    greenNeighbours[neighbour] = pixelBuffer[calcOffset + 1];
                    redNeighbours[neighbour] = pixelBuffer[calcOffset + 2];
                }
            }

            meanBlue = blueNeighbours.Average();
            meanGreen = greenNeighbours.Average();
            meanRed = redNeighbours.Average();

            for (int n = 0; n < neighbourCount; n++)
            {
                varianceBlue = varianceBlue +
                                SquareNumber(blueNeighbours[n] - meanBlue);
                varianceGreen = varianceGreen +
                                SquareNumber(greenNeighbours[n] - meanGreen);
                varianceRed = varianceRed +
                                SquareNumber(redNeighbours[n] - meanRed);
            }

            varianceBlue = varianceBlue /
                            neighbourCount *
                            varianceFactor;

            varianceGreen = varianceGreen /
                            neighbourCount *
                            varianceFactor;

            varianceRed = varianceRed /
                            neighbourCount *
                            varianceFactor;

            if (grayscaleOutput)
            {
                var pixelValue = ByteVal(ByteVal(Math.Sqrt(varianceBlue)) |
                                         ByteVal(Math.Sqrt(varianceGreen)) |
                                         ByteVal(Math.Sqrt(varianceRed)));

                resultBuffer[byteOffset] = pixelValue;
                resultBuffer[byteOffset + 1] = pixelValue;
                resultBuffer[byteOffset + 2] = pixelValue;
                resultBuffer[byteOffset + 3] = Byte.MaxValue;
            }
            else
            {
                resultBuffer[byteOffset] = ByteVal(Math.Sqrt(varianceBlue));
                resultBuffer[byteOffset + 1] = ByteVal(Math.Sqrt(varianceGreen));
                resultBuffer[byteOffset + 2] = ByteVal(Math.Sqrt(varianceRed));
                resultBuffer[byteOffset + 3] = Byte.MaxValue;
            }
        }
    }

    return resultBuffer;
}
This method features several for loops, resulting in each image pixel being iterated. Notice how the two inner most loops declare negative initializer values. In order to determine a pixel’s neighbourhood, the pixel should be considered as being located at the exact center of the neighbourhood. Negative initializer values enable the code to determine neighbouring pixels located to the left and above of the pixel being iterated.
A pixel neighbourhood needs to be determined in terms of each colour channel, Red, Green and Blue. The pixel neighbourhood of each colour channel must be averaged individually. Logically it follows that pixel neighbourhood variance should also be calculated per colour channel.
The method signature indicates the varianceFactor parameter should be optional and assigned a default value of 1.0. Should a variance factor not be required, implementing a default factor value of 1.0 will not result in any change to the calculated variance value.
When grayscale output has been configured the resulting output pixel will express the same value on all three colour channels. The grayscale value will be calculated through the application of a bitwise OR operation, applied to the standard deviation of each colour channel. The square root of a pixel neighbourhood’s variance provides the standard deviation value for that pixel neighbourhood.
If grayscale output had not been configured the resulting pixel colour channels will be assigned the standard deviation of the related colour channel on the source pixel.
private const byte maxByteValue = Byte.MaxValue;
private const byte minByteValue = Byte.MinValue;

public static byte ByteVal(int val)
{
    if (val < minByteValue) { return  minByteValue; }
    else if (val > maxByteValue) { return  maxByteValue; }
    else { return (byte)val; }
}
The StandardDeviationEdgeDetection method reflects several references to the ByteVal method, as illustrated in the code snippet above. Casting double and int values to byte values could result in values exceeding the upper and lower bounds allowed by the byte type. The ByteVal method tests whether a value would exceed upper and lower bounds, when determined to do so the resulting value is assigned either the upper inclusive bound or lower inclusive bound value, depending on the bound being exceeded.
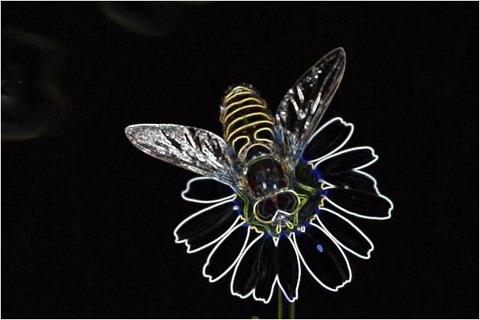
Bee Filter 3×3 Factor 5
Sample Images
This article features several sample images provided as examples. All sample images were created using the sample application. All of the original source images used in generating sample images have been licensed by their respective authors to allow for reproduction here. The following section lists each original source image and related license and copyright details.
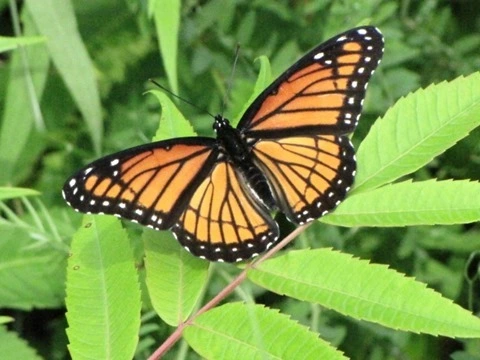
Viceroy (Limenitis archippus), Mer Bleue Conservation Area, Ottawa, Ontario © 2008 D. Gordon E. Robertson is used here under a Creative Commons Attribution-Share Alike 3.0 Unported license.
Old World Swallowtail on Buddleja davidii © 2008 Thomas Bresson is used here under a Creative Commons Attribution 2.0 Generic license.
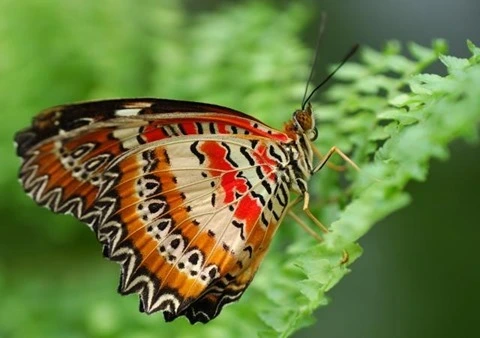
Cethosia cyane butterfly © 2006 Airbete is used here under a Creative Commons Attribution-Share Alike 3.0 Unported license.
“Weiße Baumnymphe (Idea leuconoe) fotografiert im Schmetterlingshaus des Maximilianpark Hamm” © 2009 Steffen Flor is used here under a Creative Commons Attribution-Share Alike 3.0 Unported license.
"Dark Blue Tiger tirumala septentrionis by kadavoor" © 2010 Jeevan Jose, Kerala, India is used here under a Creative Commons Attribution-ShareAlike 4.0 International License
"Common Lime Butterfly Papilio demoleus by Kadavoor" © 2010 Jeevan Jose, Kerala, India is used here under a Creative Commons Attribution-ShareAlike 4.0 International License
Syrphidae, Knüllwald, Hessen, Deutschland © 2007 Fritz Geller-Grimm is used here under a Creative Commons Attribution-Share Alike 3.0 Unported license
Related Articles and Feedback
Feedback and questions are always encouraged. If you know of an alternative implementation or have ideas on a more efficient implementation please share in the comments section.
I’ve published a number of articles related to imaging and images of which you can find URL links here:
- C# How to: Image filtering by directly manipulating Pixel ARGB values
- C# How to: Image filtering implemented using a ColorMatrix
- C# How to: Blending Bitmap images using colour filters
- C# How to: Bitmap Colour Substitution implementing thresholds
- C# How to: Generating Icons from Images
- C# How to: Swapping Bitmap ARGB Colour Channels
- C# How to: Bitmap Pixel manipulation using LINQ Queries
- C# How to: Linq to Bitmaps – Partial Colour Inversion
- C# How to: Bitmap Colour Balance
- C# How to: Bi-tonal Bitmaps
- C# How to: Bitmap Colour Tint
- C# How to: Bitmap Colour Shading
- C# How to: Image Solarise
- C# How to: Image Contrast
- C# How to: Bitwise Bitmap Blending
- C# How to: Image Arithmetic
- C# How to: Image Convolution
- C# How to: Image Edge Detection
- C# How to: Difference Of Gaussians
- C# How to: Image Median Filter
- C# How to: Image Unsharp Mask
- C# How to: Image Colour Average
- C# How to: Image Erosion and Dilation
- C# How to: Morphological Edge Detection
- C# How to: Boolean Edge Detection
- C# How to: Gradient Based Edge Detection
- C# How to: Sharpen Edge Detection
- C# How to: Image Cartoon Effect
- C# How to: Calculating Gaussian Kernels
- C# How to: Image Blur
- C# How to: Image Transform Rotate
- C# How to: Image Transform Shear
- C# How to: Compass Edge Detection
- C# How to: Oil Painting and Cartoon Filter
- C# How to: Stained Glass Image Filter
- C# How to: Image ASCII Art
- C# How to: Weighted Difference of Gaussians
- C# How to: Image Boundary Extraction
- C# How to: Image Abstract Colours Filter
- C# How to: Fuzzy Blur Filter



0 Responses to “C# How to: Standard Deviation Edge Detection”